Gene Expression
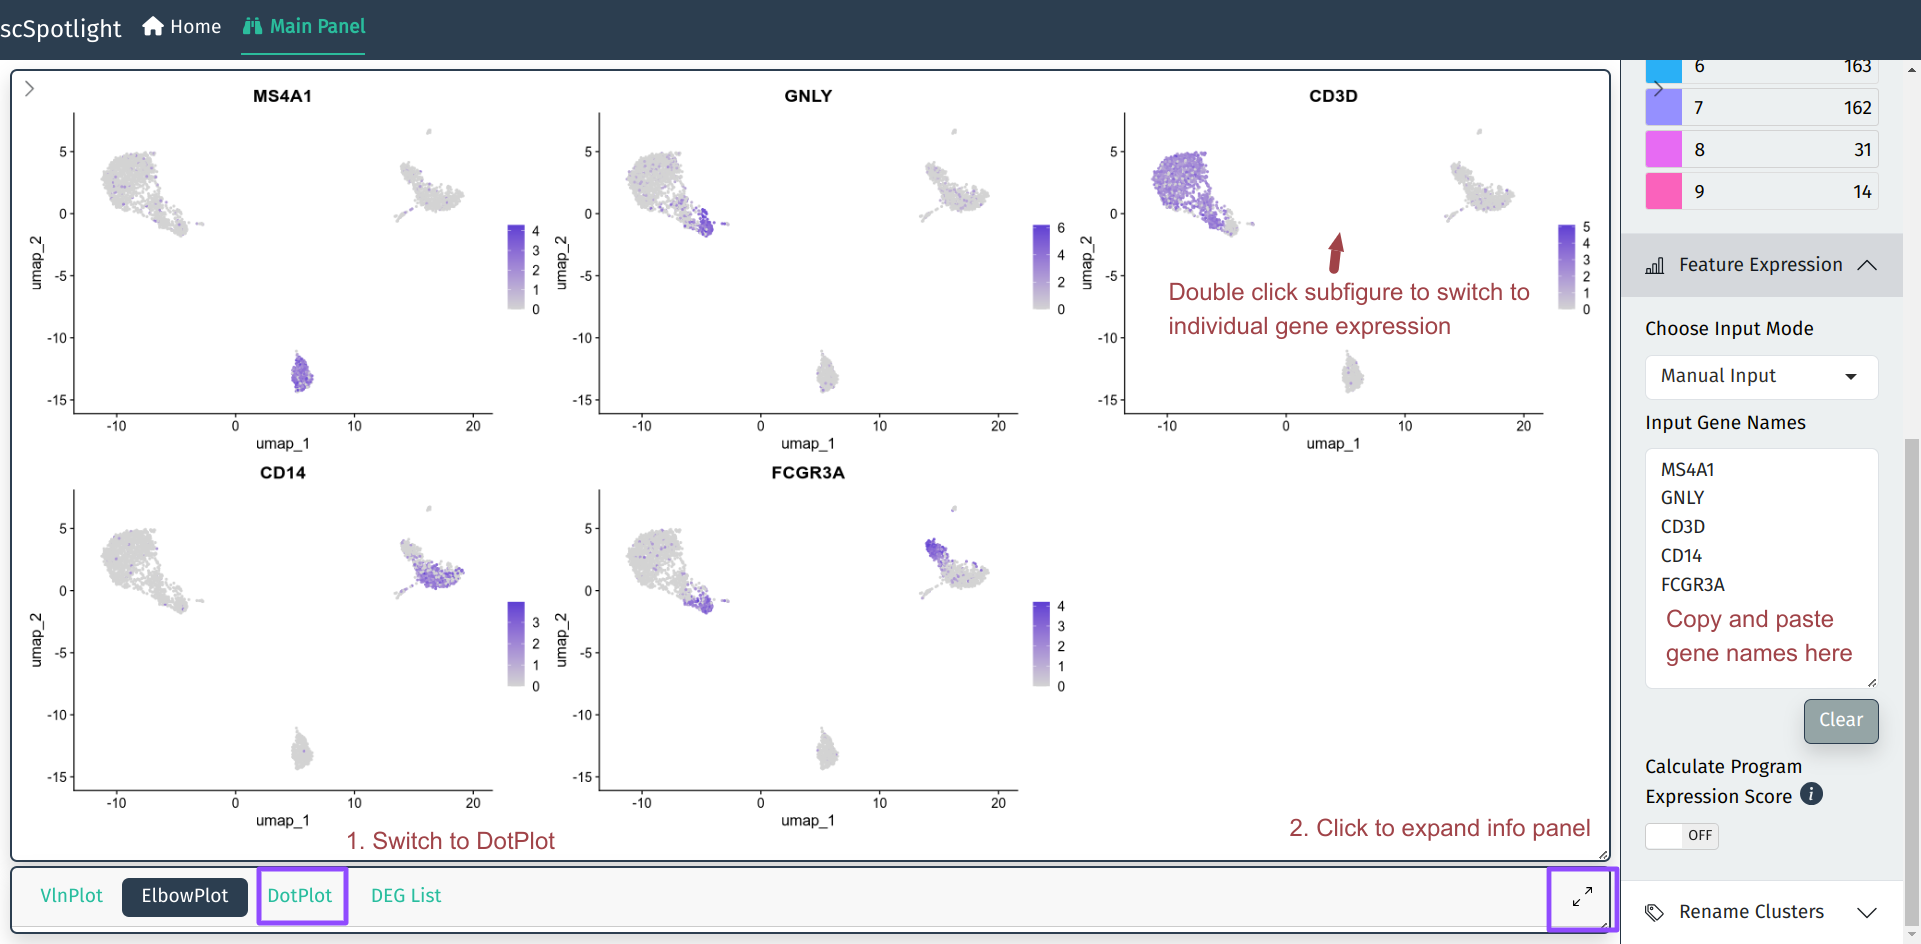
The most frequent request during scRNAseq analysis might be checking genes’ expression, manually annotating cell type is to align marker gene expression to unsupervised cell clusters. This process requires user to repeatedly tune the clustering parameters and verify markers’ expression in the results. scSpotlight tries to simplify gene query process and make the whole step easier and more intuitive.
Multiple Genes
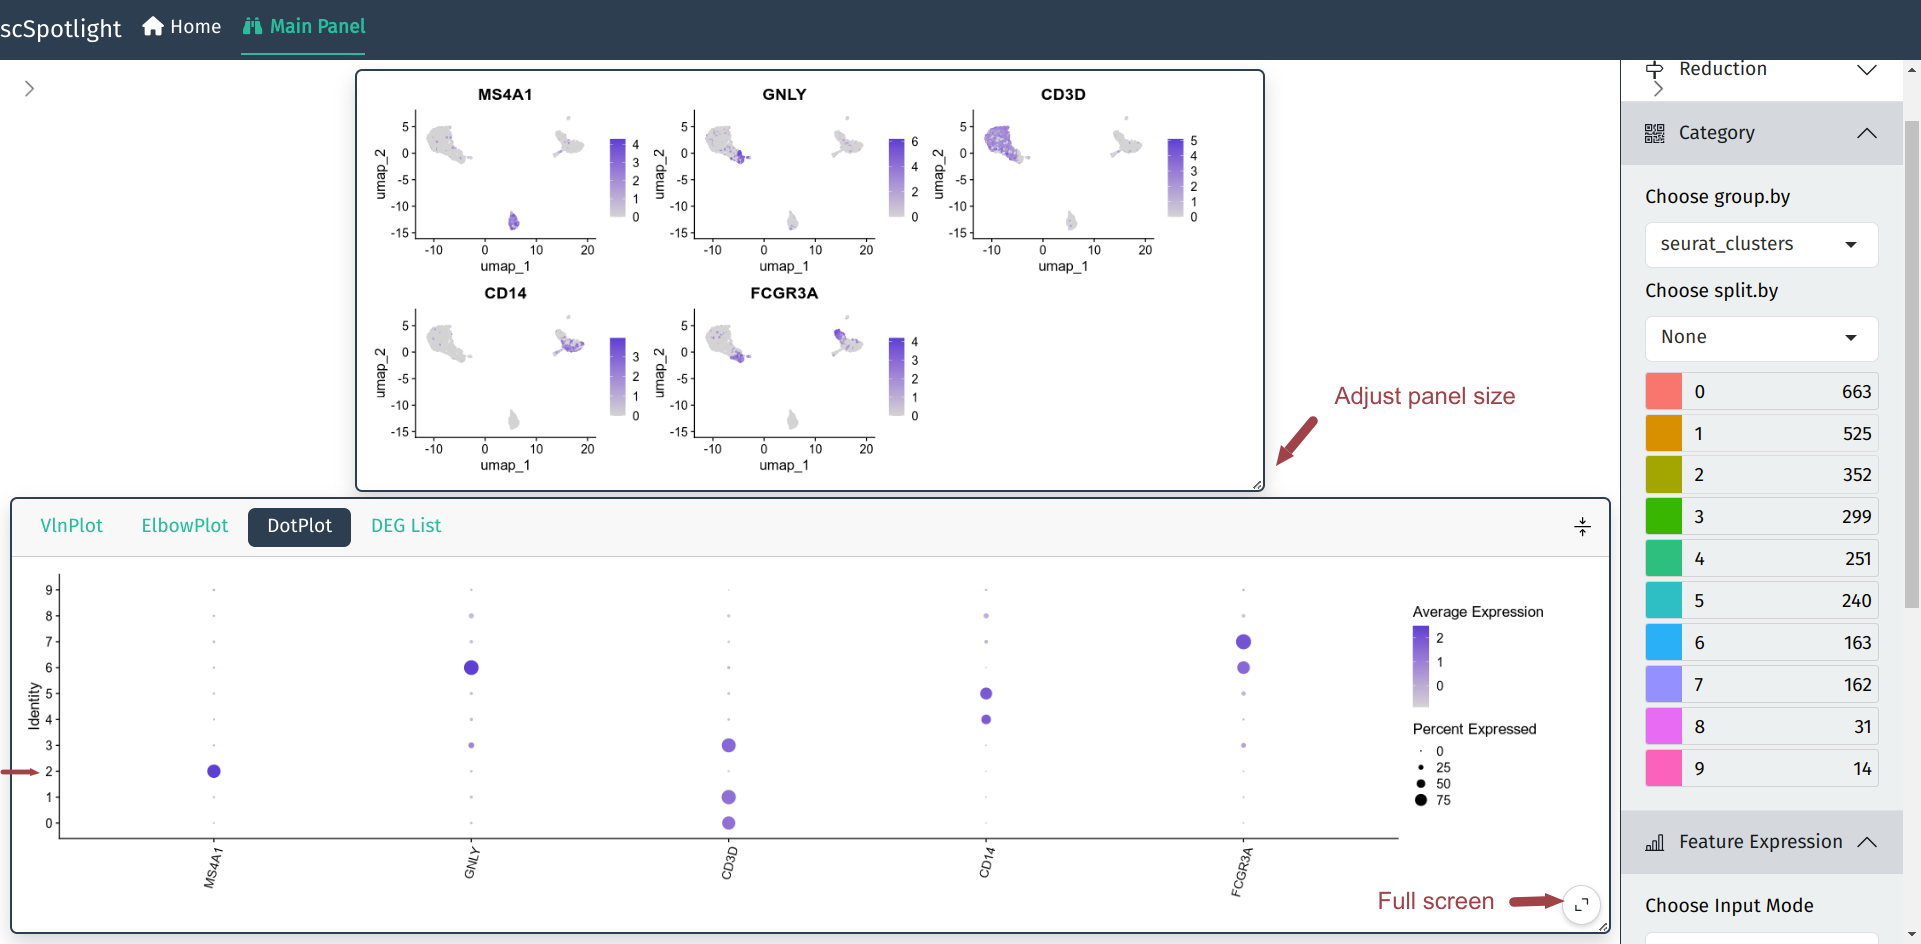
User could input multiple gene names (symbols) in the Feature Expression module and the main plot panel will switch to Seurat::FeaturePlot to represent gene expression on UMAP plot. User could also check the expression in Seurat::DotPlot, which could better dipict the percentage of cells in the cluster expressing the gene of interest.
Individual Gene
For individual genes, user could double click the subfigure of the FeaturePlot to “zoom in”. The UMP/TSNE of the cell clusters and the gene expression will be shown side by side. Hovering category labels will highlight the cells of the cluster. Meanwhile, one also could view the gene expression in the Seurat::VlnPlot after expanding the info panel.

