Filter Cells
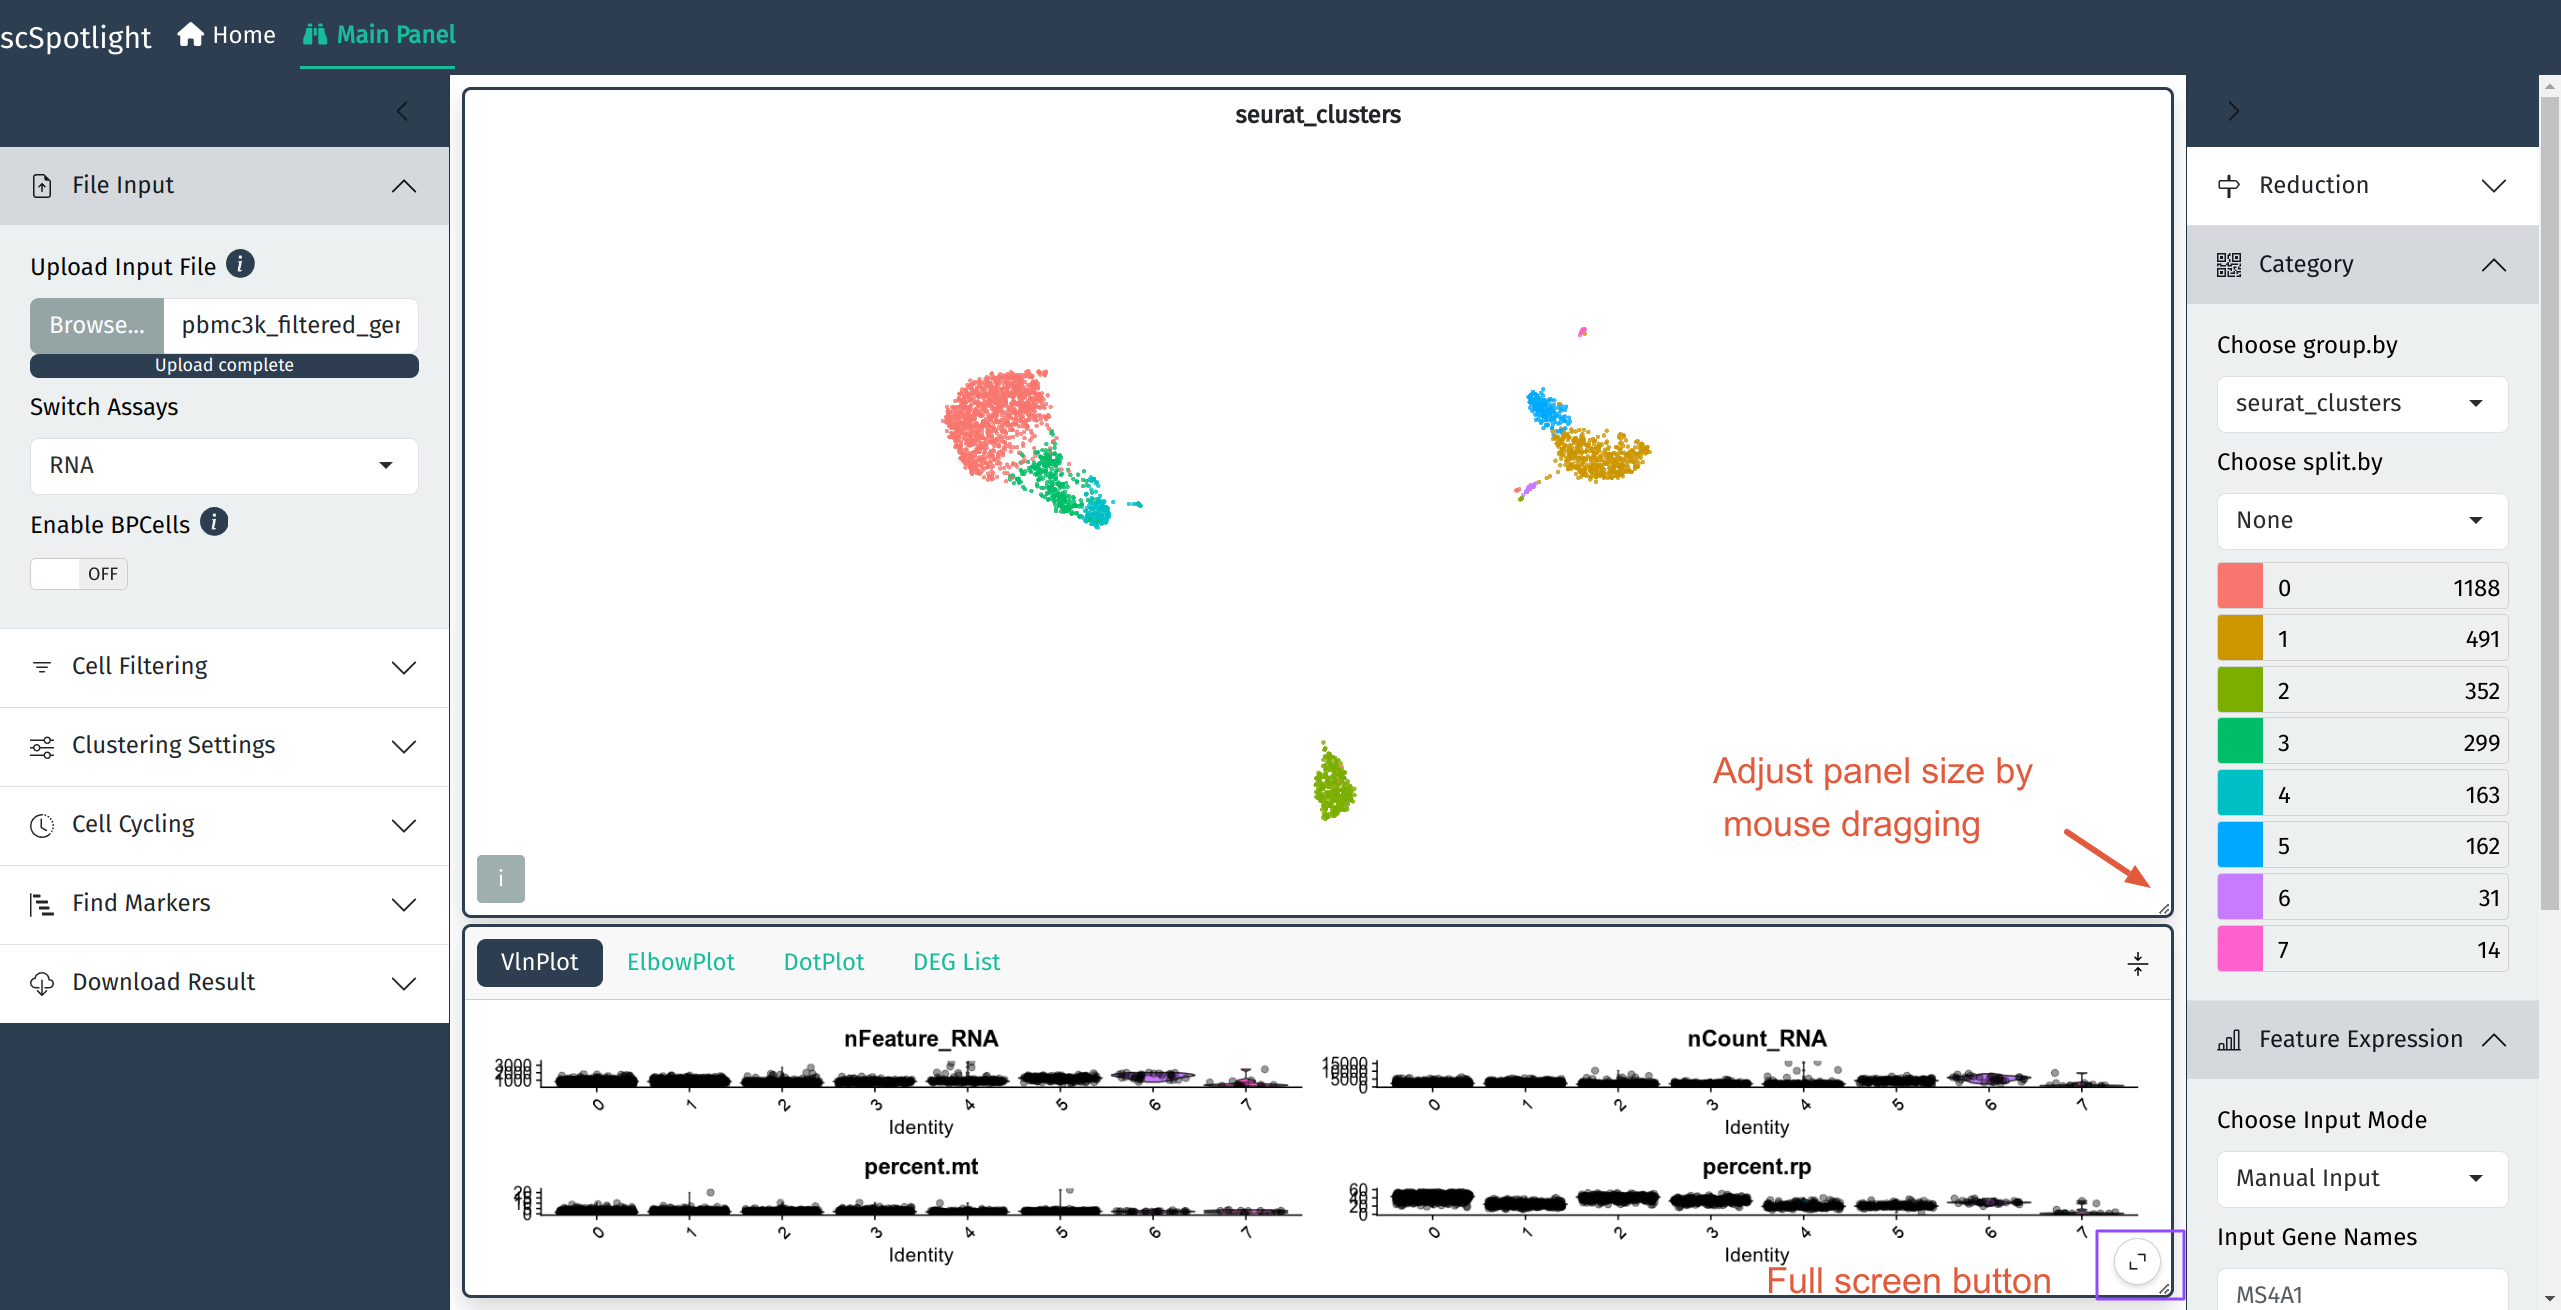
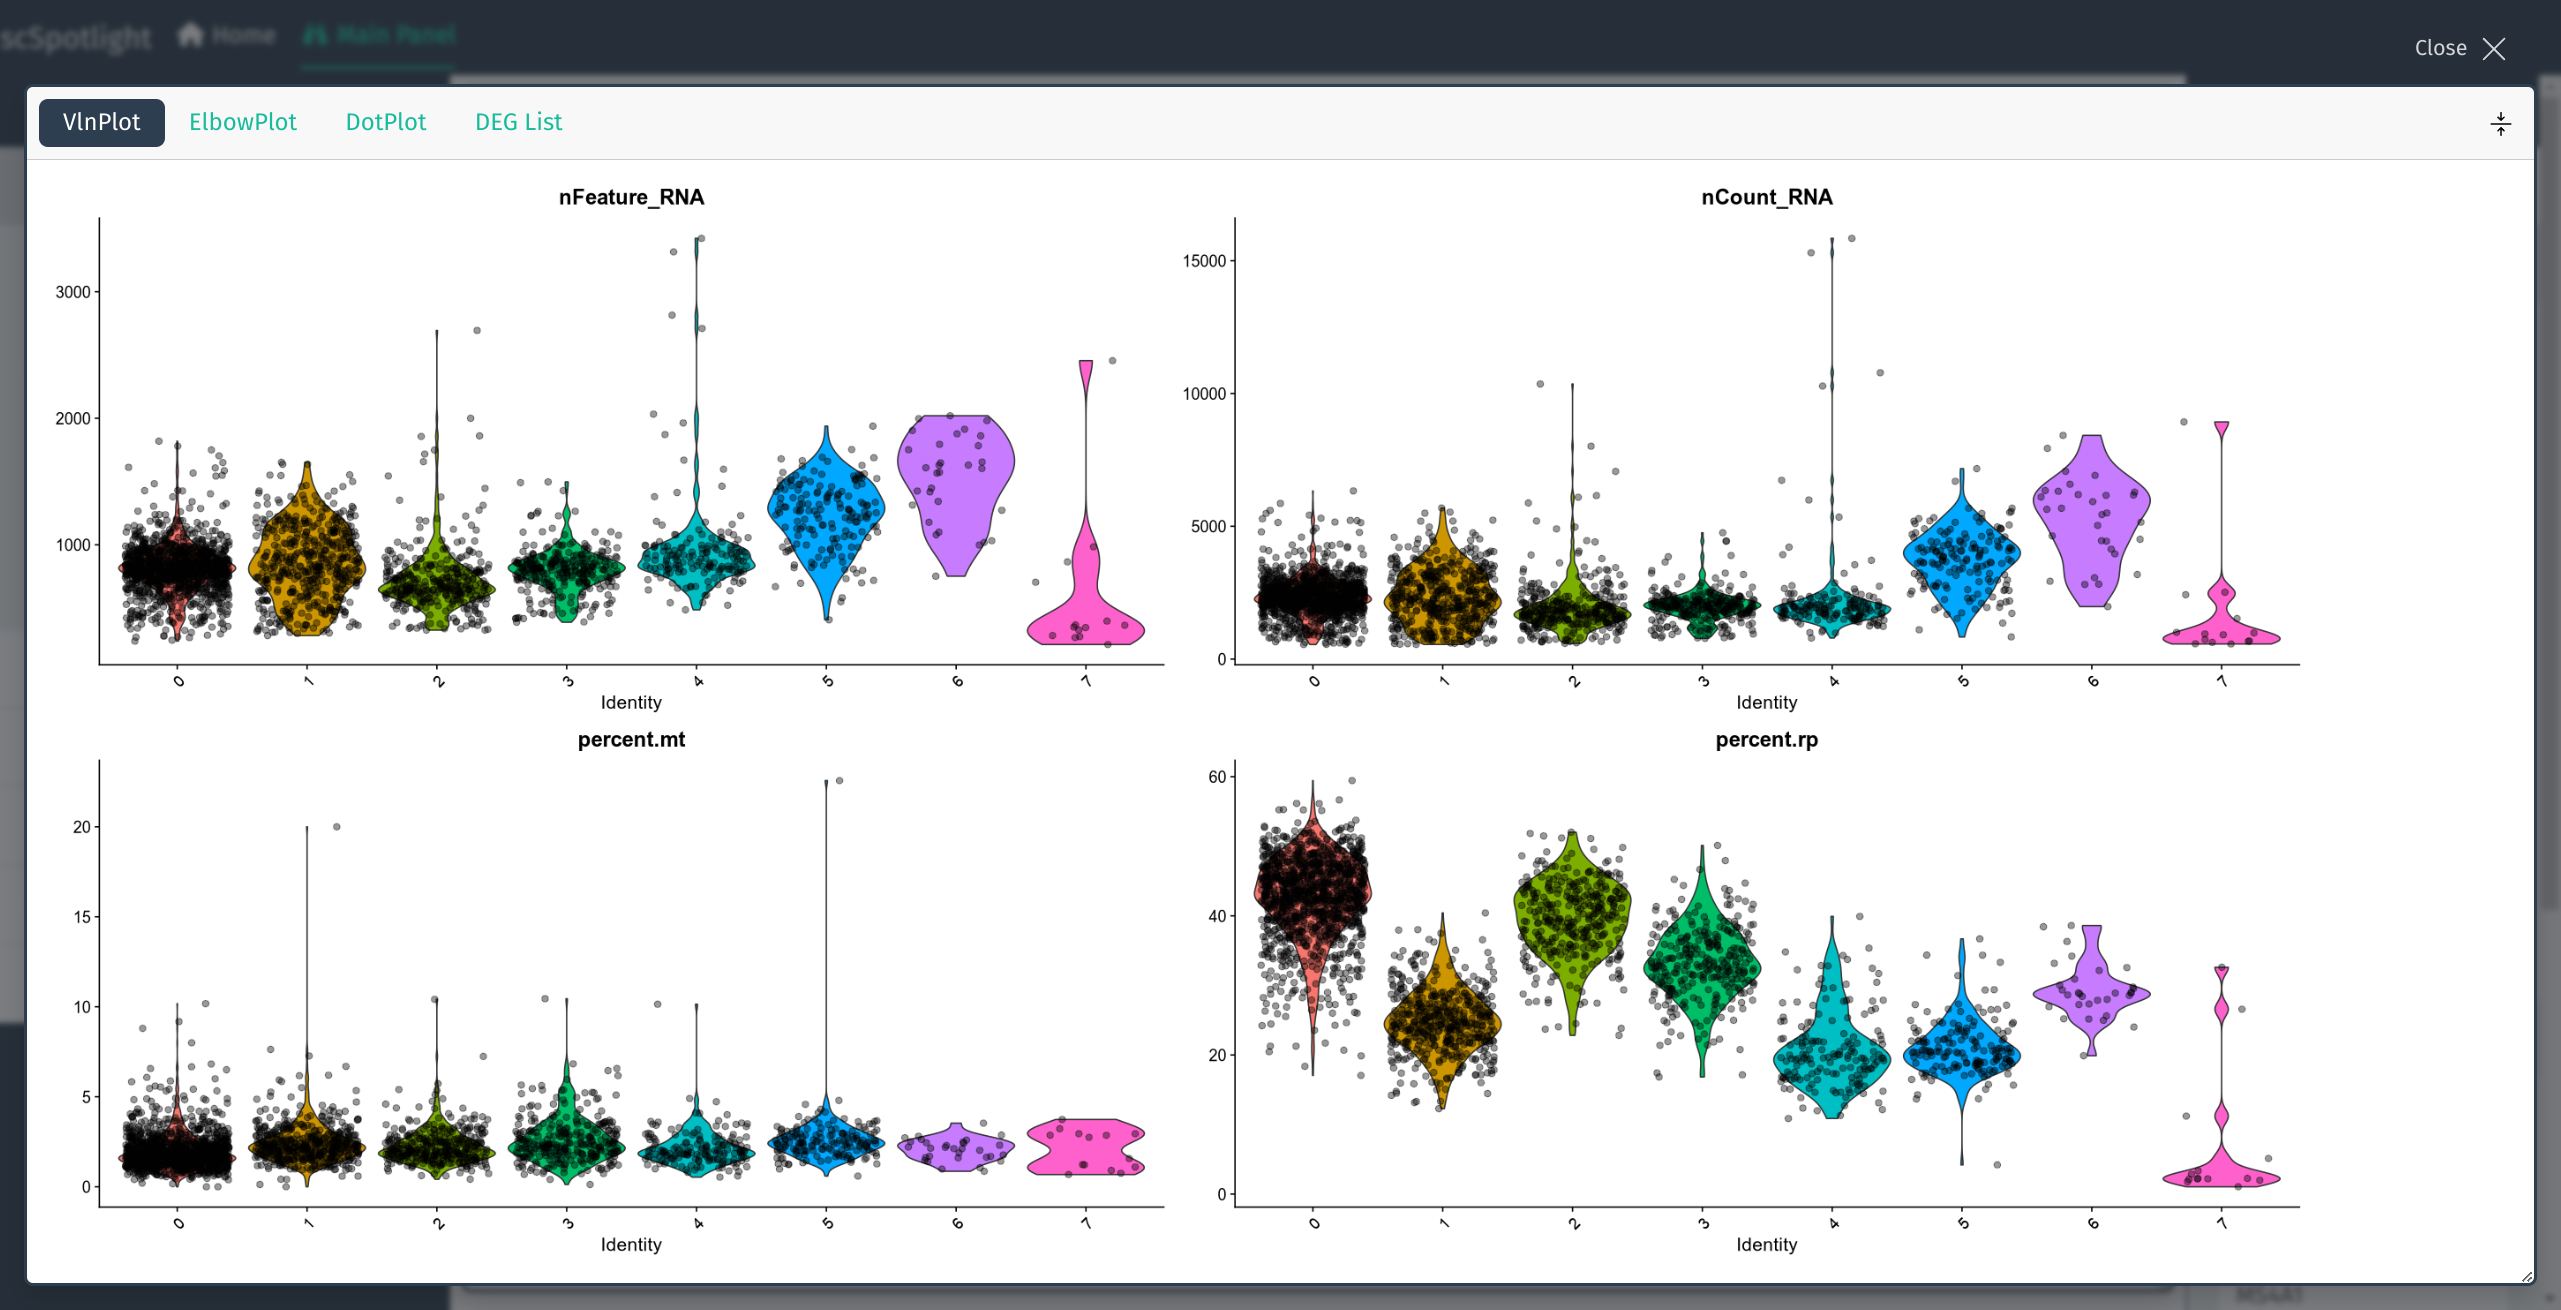
After uploading compressed matrix tarball, scSpotlight will automatically process the data with a standard Seurat workflow and illustrate the UMAP and cell clusters in the main panel. The number of genes detected (nFeature_RNA) in each cell, number of UMIs (nCount_RNA), percentage of the mitochondrial UMIs (percent.mt), percentage of the ribosomal protein UMIs (percent.rp) will be summarized via a violin plot in the lower information panel.
After expanding the informaiton panel, user could drag the lower right corner of the main panel to adjust the panel size.
QC metrics and filtration criteria
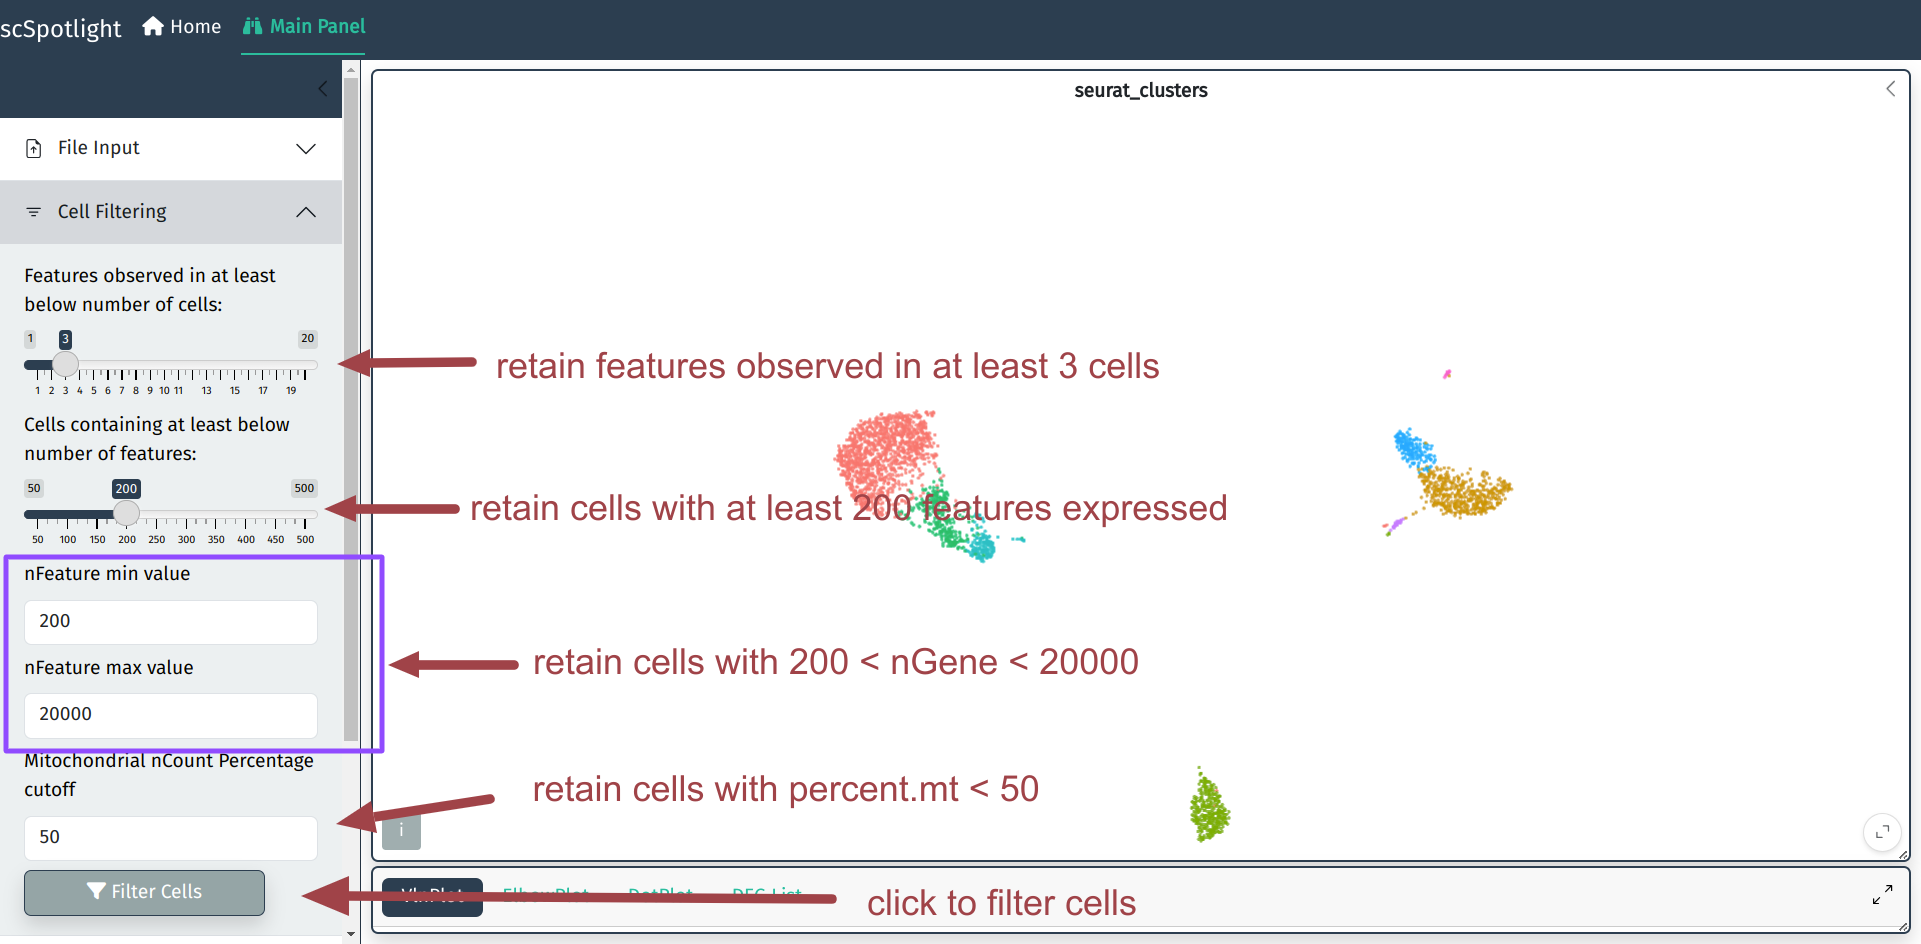
Here we use the same QC metrics and filtering criteria as Seurat tutorial:
- Discard cells/droplets with too few genes detected or too many genes.
- Low-quality cells or empty droplets will often have very few genes
- Cell doublets or multiplets may exhibit an aberrantly high gene count
- Similarly, the total number of molecules detected within a cell (correlates strongly with unique genes), thus only filter nGene is sufficient
- Discard cells/droplets with high percentage UMIs belonging to mitochondrial mRNA
- Low-quality / dying cells often exhibit extensive mitochondrial contamination
- We calculate mitochondrial QC metrics with the PercentageFeatureSet() function, which calculates the percentage of counts originating from a set of features
- We use the set of all genes starting with MT- as a set of mitochondrial genes
Discard low quality cells
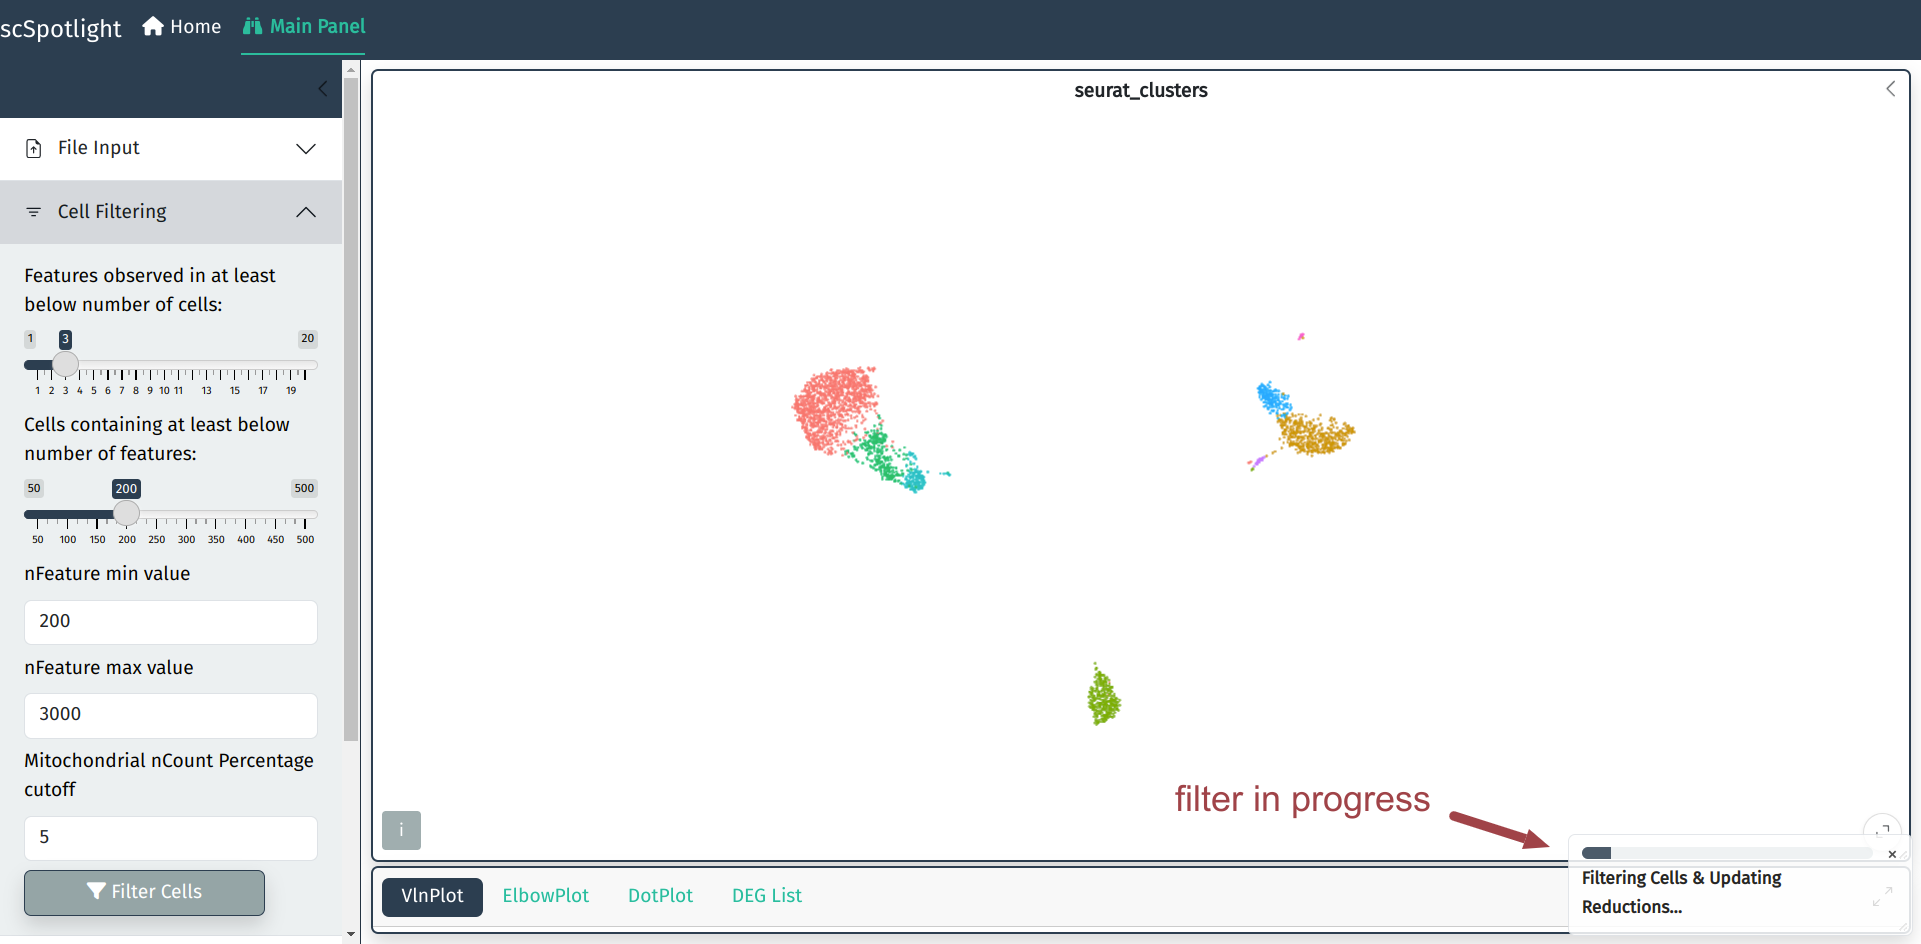
User could adjust cell filtering criteria, different dataset (with varies sequencing depth) might need to use different maximum number of genes.


